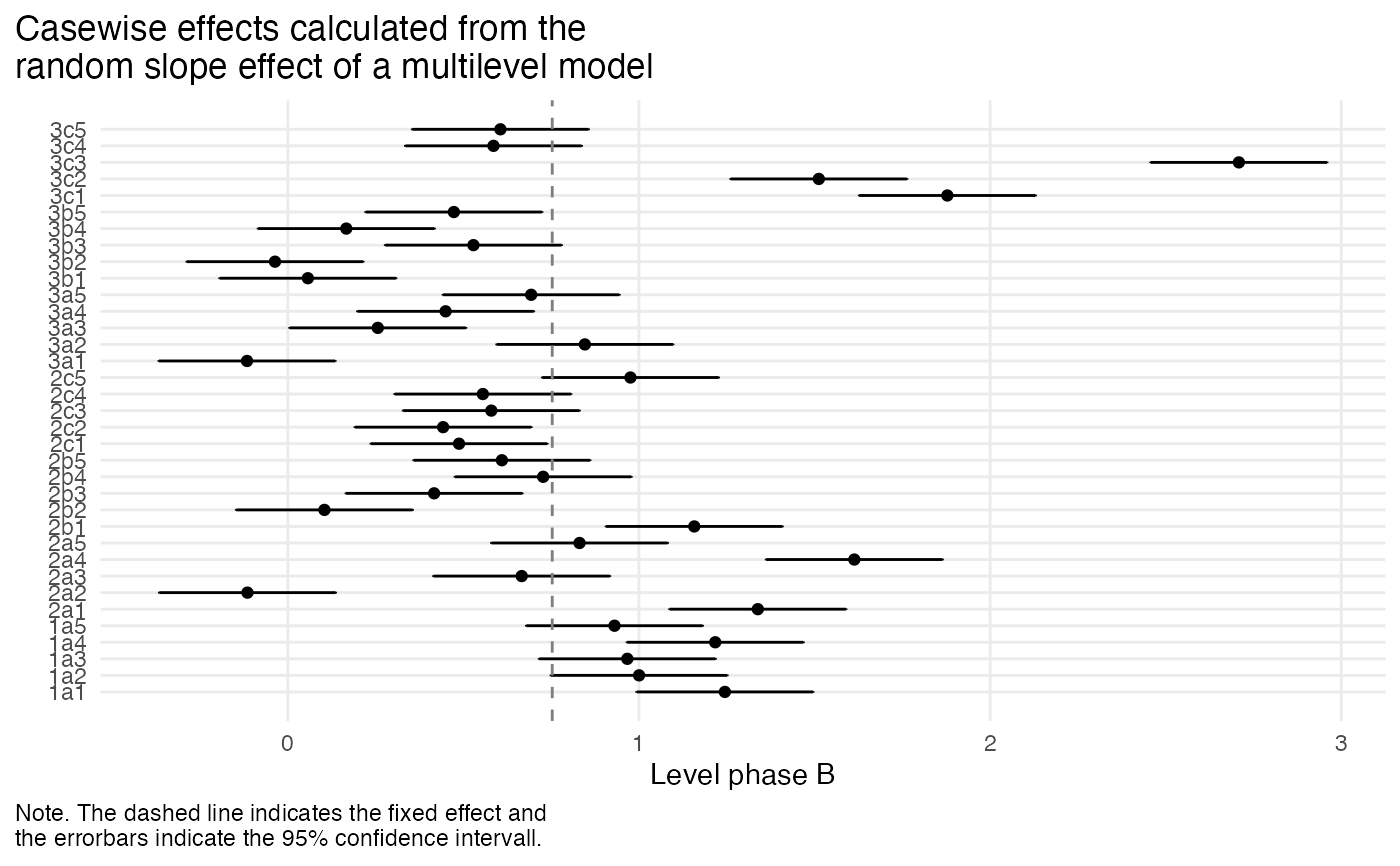
This function generates a forest plot for the random effects of a mixed hplm model
plot.sc_hplm.RdThis function generates a forest plot for the random effects of a mixed hplm model
# S3 method for sc_hplm
plot(x, effect = "intercept", mark = "fixed", ci = 0.95, ...)
Arguments
- x
The return from the
hplm()function.- effect
The specific effect to be plotted (default is the intercept).
- mark
Set a reference line.
- ci
Value between 0 and 1 for calculating the confidence interval.
- ...
Further arguments.
Value
A forest plot displaying Tau-U effects.