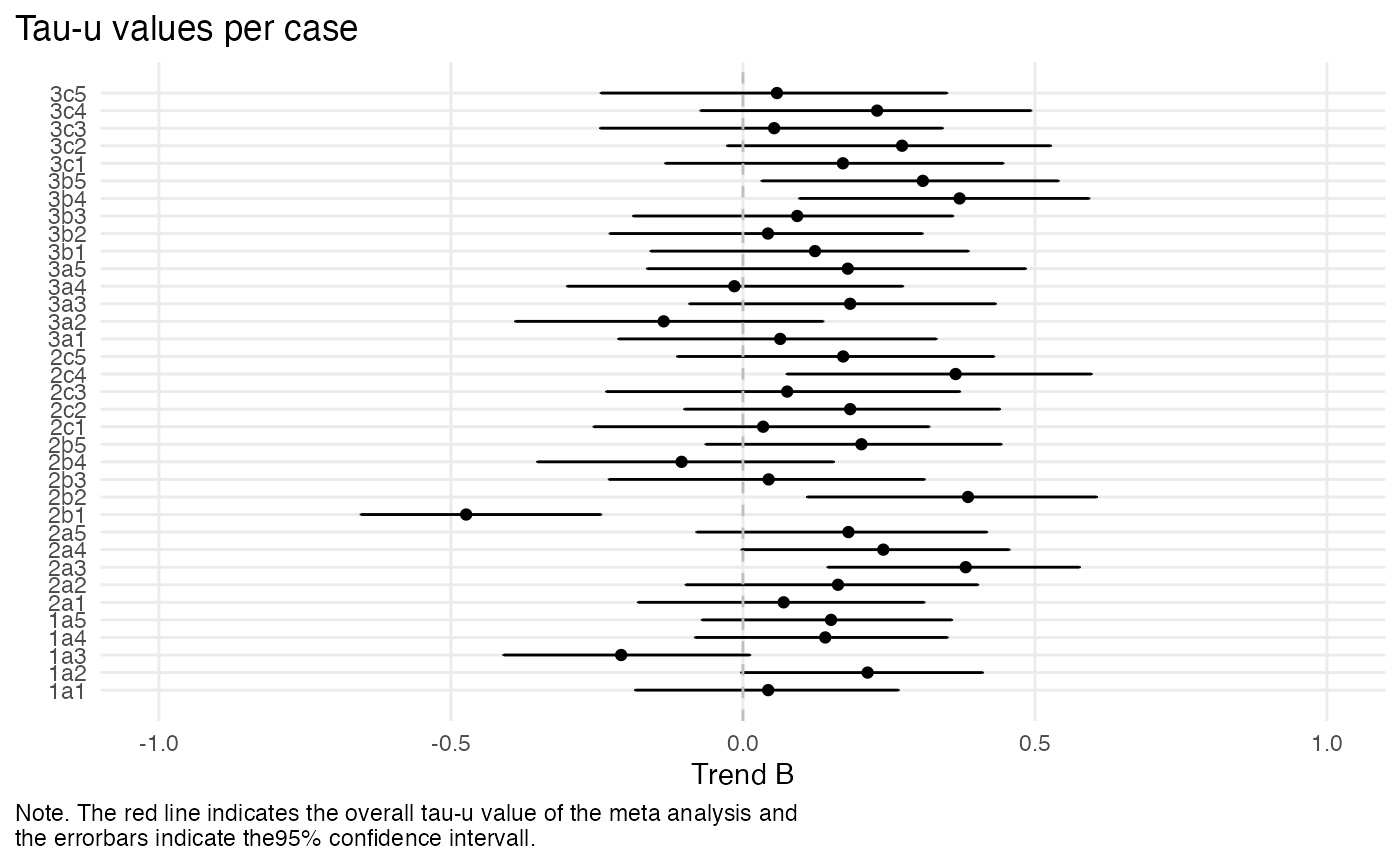
Plot Tau-U Effects Forest Plot
scplot.sc_tauu.RdThis function generates a forest plot of Tau-U effects.
# S3 method for class 'sc_tauu'
scplot(object, effect = 1, ...)
Arguments
- object
The return from the
tau_u()function.- effect
The specific effect to be plotted (default is "A vs. B - Trend A").
- ...
Further arguments.
Value
A forest plot displaying Tau-U effects.
Examples
res <- scan::tau_u(scan::Leidig2018)
scplot(res, effect = 3)
#> ℹ Possible effects are:
#>   1: 'A vs. B'
#>   2: 'Trend A'
#>   3: 'Trend B'
#>   4: 'A vs. B - Trend A'
#>   5: 'A ... [truncated]
#> `height` was translated to `width`.