Split Treatment Dataline
split_dataline.RdThis function takes a scplot object and adds treatment datalines according to the specified variables.
split_dataline(
  object,
  tvar,
  dvar = NULL,
  levels = NULL,
  labels = NULL,
  remove_original = TRUE,
  color = NULL,
  ...
)
Arguments
- object
A scplot object containing the scdf data.
- tvar
The treatment variable.
- dvar
The dependent variable which provides the values for the new datalines. If NULL, the default dependent variable of the scplot object is used.
- levels
Optional, a vector of treatment levels.
- labels
Optional, labels for the treatment levels.
- remove_original
Logical, should the original dependent variable be removed from the cases where the treatment variable matches the level? (default is FALSE).
- color
Optional, a vector of colors for the new datalines. If provided, the length of the color vector should match the number of treatment levels. If not provided, default colors will be used for the datalines.
- ...
Additional arguments.
Value
The modified scplot object with added datalines.
Details
The function identifies unique treatment levels from the specified treatment variable and creates new datalines for each level. The new datalines are added to the scplot object, and the original dependent variable can optionally be removed from cases where the treatment variable matches the level.
Examples
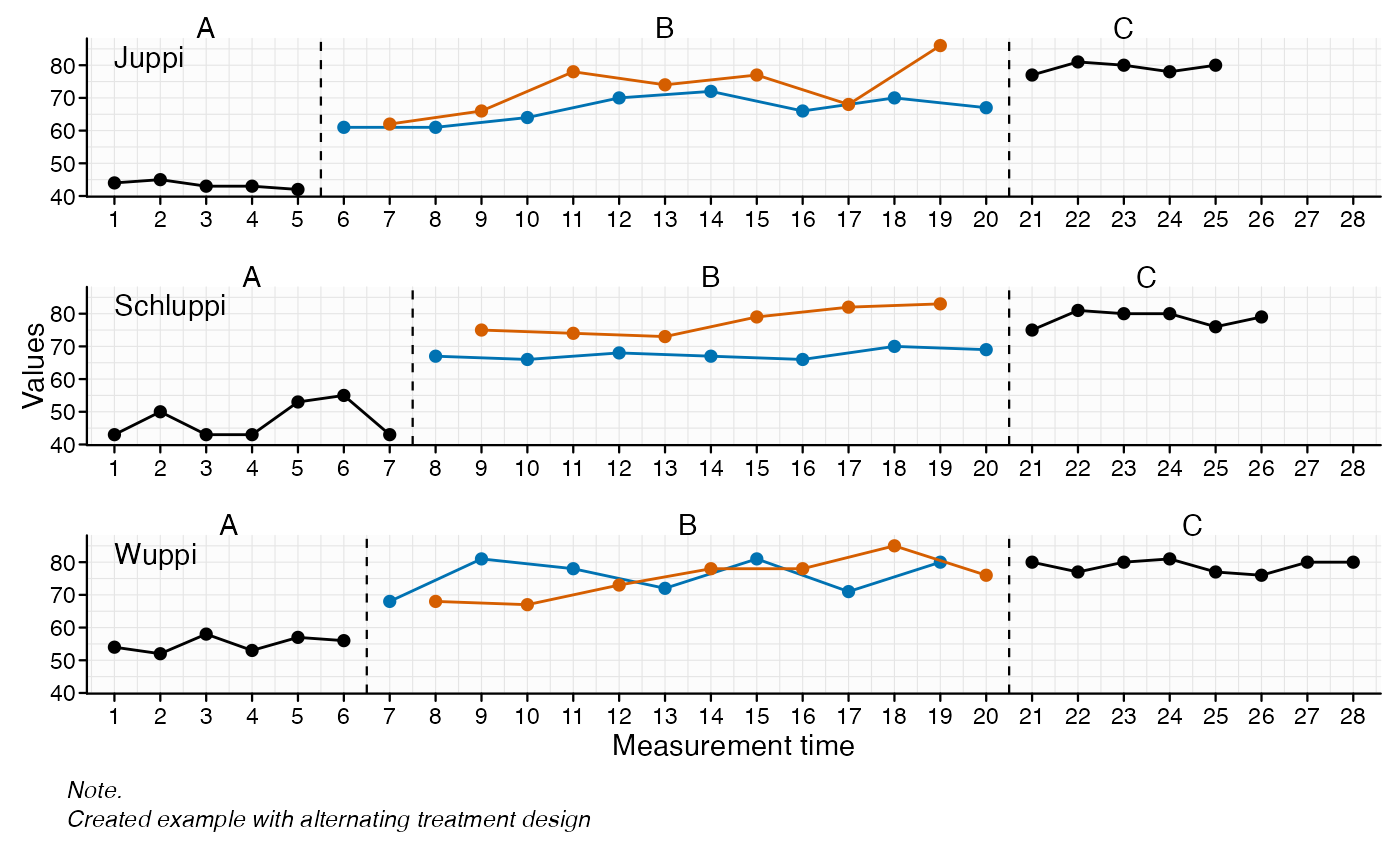
scplot(scan::example_atd) |>
  split_dataline("treatment")