Add a legend to an scplot
add_legend.RdThis function adds a legend to an scplot object. The legend can include
entries for datalines, statlines, and phases. You can customize the position
of the legend, as well as the text style for the title and text within the
legend.
add_legend(
  object,
  labels = NULL,
  section_labels = c("Lines", "Phases"),
  position = "right",
  datalines = TRUE,
  statlines = TRUE,
  phases = TRUE,
  title = NULL,
  text = NULL,
  background = NULL
)
Arguments
- object
An scplot object (class
scplot) returned from thescplot()function.- labels
A Character vector with text labels.
- section_labels
A character vector of length two. The labels for the lines section and phase section.
- position
The position ("none", "left", "right", "bottom", "top", or two-element numeric vector) of the legend. The two-element numeric vector specifies the x and y coordinates of the legend relative to the plot area (e.g.,
c(0.5, 0.5)for the center).- datalines
If TRUE, a legend for the datalines is generated.
- statlines
If TRUE, a legend for the statlines is generated.
- phases
If TRUE, a legend for the phases is generated. Note that you also have to set the
set_panelargument (e.g.,set_panel(fill = c("lightblue", "grey80"))).- title
A list with text style parameters for the title.
- text
List with text parameters (
"family", "face", "colour", "size", "hjust", "vjust", "angle", "lineheight", "margin"). Seeelement_text().- background
A list with background styling arguments (fill, color, size, linetype).
Value
An object of class scplot (seescplot()) with changed element
legend.
Details
The position argument allows you to specify where the legend should be
placed on the plot. You can also customize the text style for the title and
text within the legend using the title and text arguments, respectively.
The background argument allows you to set the background style of the
legend. Deprecated argument: The labels argument is deprecated. Please set
the label argument in the add_statline and set_dataline functions
instead. The legend can be customized to include different sections for
datalines, statlines, and phases. You can control which sections are included
in the legend using the datalines, statlines, and phases arguments.
Examples
data(exampleAB_add, package = "scan")
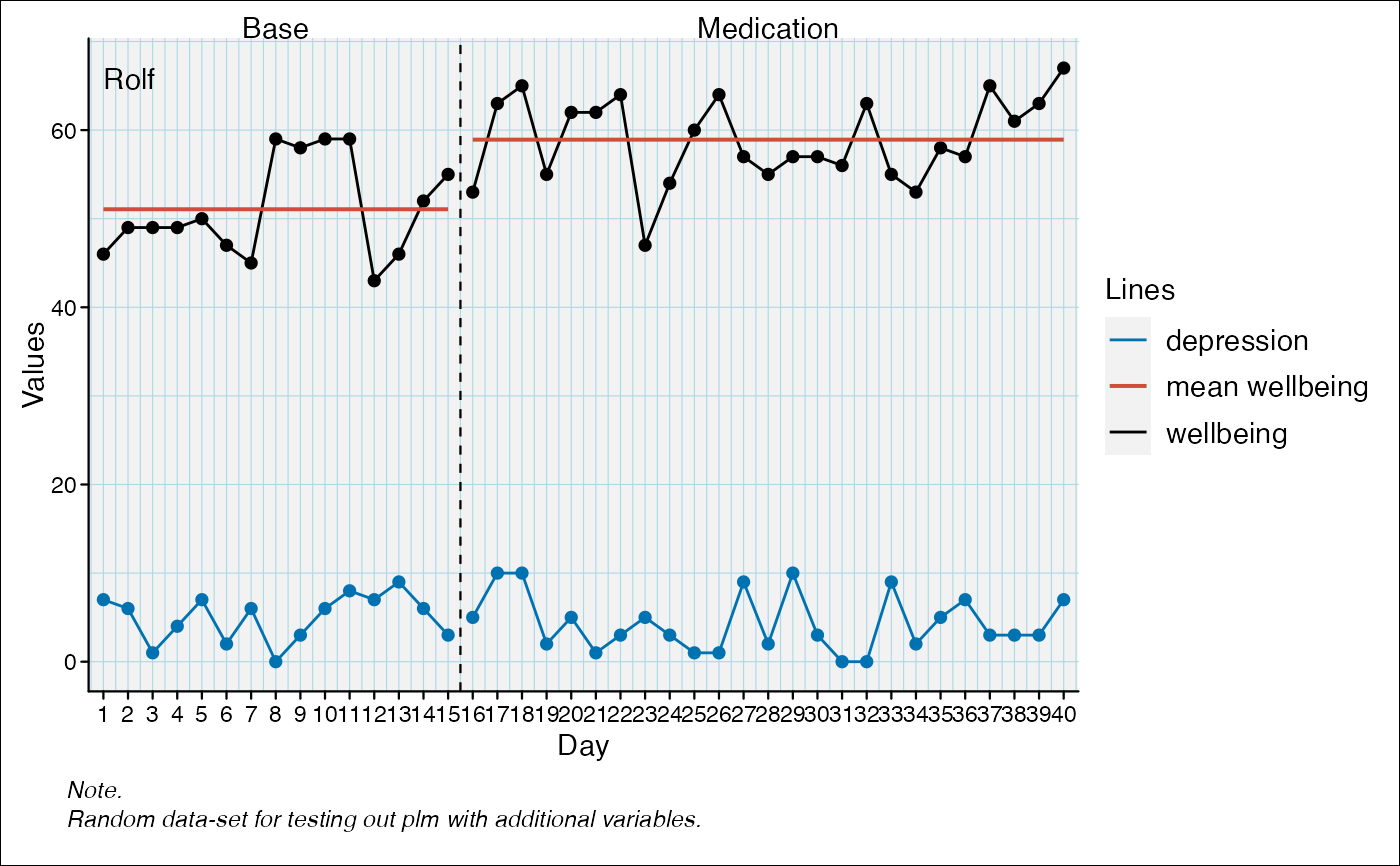
scplot(exampleAB_add) |>
set_dataline("depression") |>
add_statline("mean") |>
add_legend()
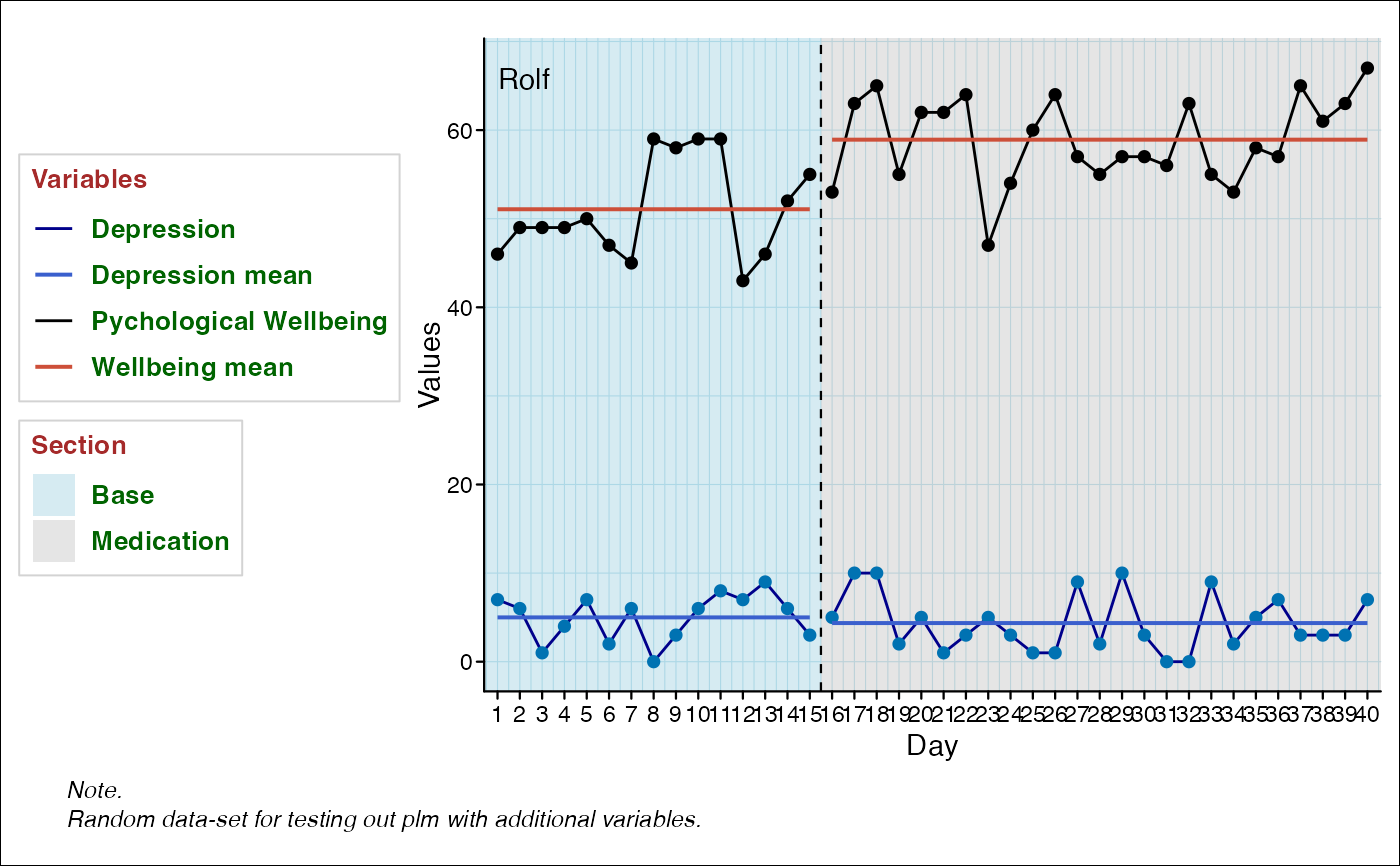
 scplot(exampleAB_add) |>
set_dataline(label = "Pychological Wellbeing") |>
set_dataline("depression", color = "darkblue", label = "Depression") |>
add_statline("mean", label = "Wellbeing mean") |>
add_statline("mean", variable = "depression", label = "Depression mean") |>
set_phasenames(color = NA) |>
set_panel(fill = c("lightblue", "grey80")) |>
add_legend(
position = "left",
section_labels = c("Variables", "Section"),
title = list(color = "brown", size = 10, face = 2),
text = list(color = "darkgreen", size = 10, face = 2),
background = list(color = "lightgrey")
)
scplot(exampleAB_add) |>
set_dataline(label = "Pychological Wellbeing") |>
set_dataline("depression", color = "darkblue", label = "Depression") |>
add_statline("mean", label = "Wellbeing mean") |>
add_statline("mean", variable = "depression", label = "Depression mean") |>
set_phasenames(color = NA) |>
set_panel(fill = c("lightblue", "grey80")) |>
add_legend(
position = "left",
section_labels = c("Variables", "Section"),
title = list(color = "brown", size = 10, face = 2),
text = list(color = "darkgreen", size = 10, face = 2),
background = list(color = "lightgrey")
)