Create a Percentage Bar Chart
percentage_bar.RdThis function creates a percentage bar chart using ggplot2, where the user can specify the percentage to be represented as a bar along with an optional label.
percentage_bar(perc, label)Arguments
Value
A ggplot2 bar chart representing the given percentage value.
Examples
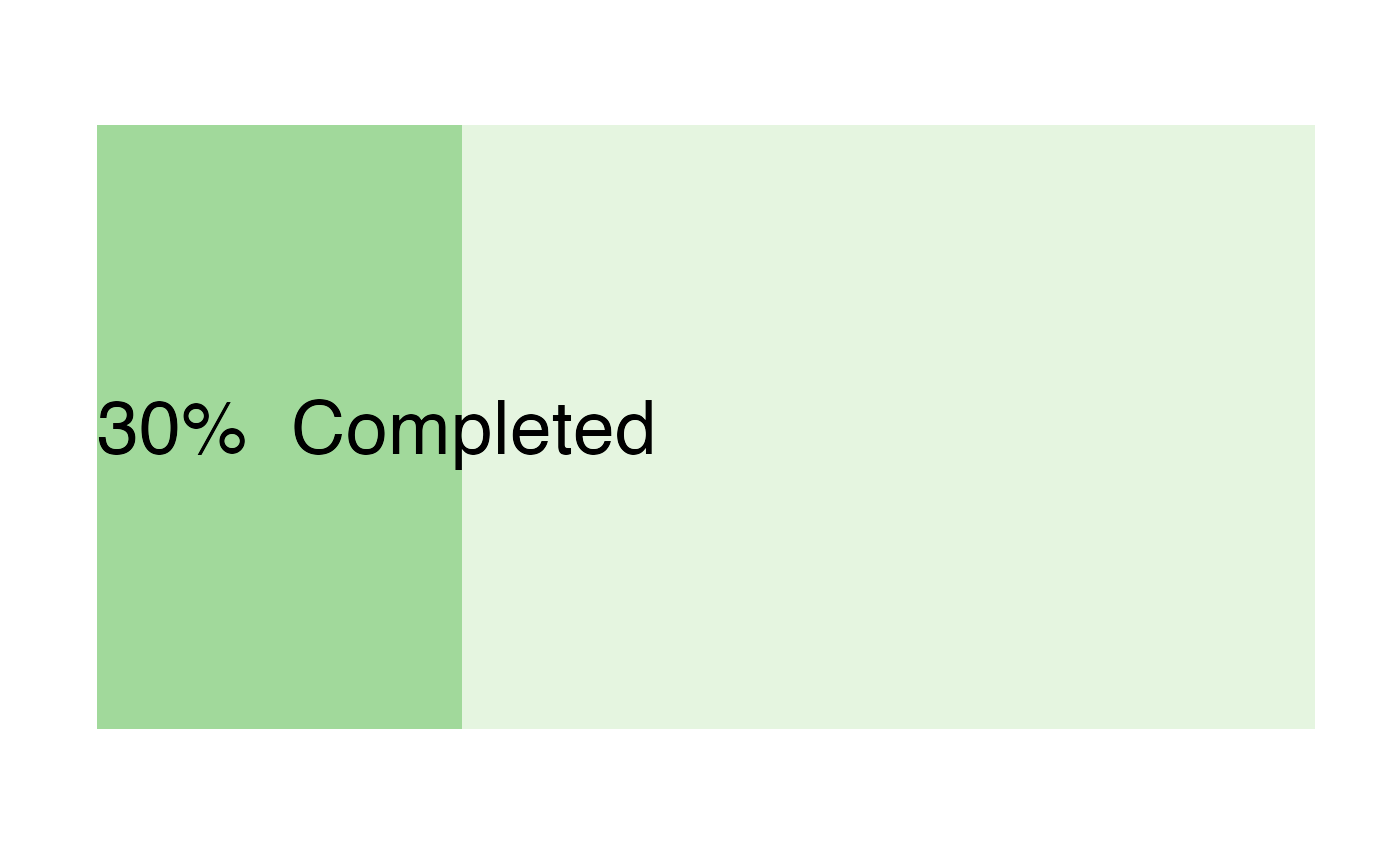
# Create a percentage bar chart with 30% labeled as "Completed"
percentage_bar(30, "Completed")
#> Warning: Unknown palette: "Set4"