Plot Alpha and Beta Error Regions
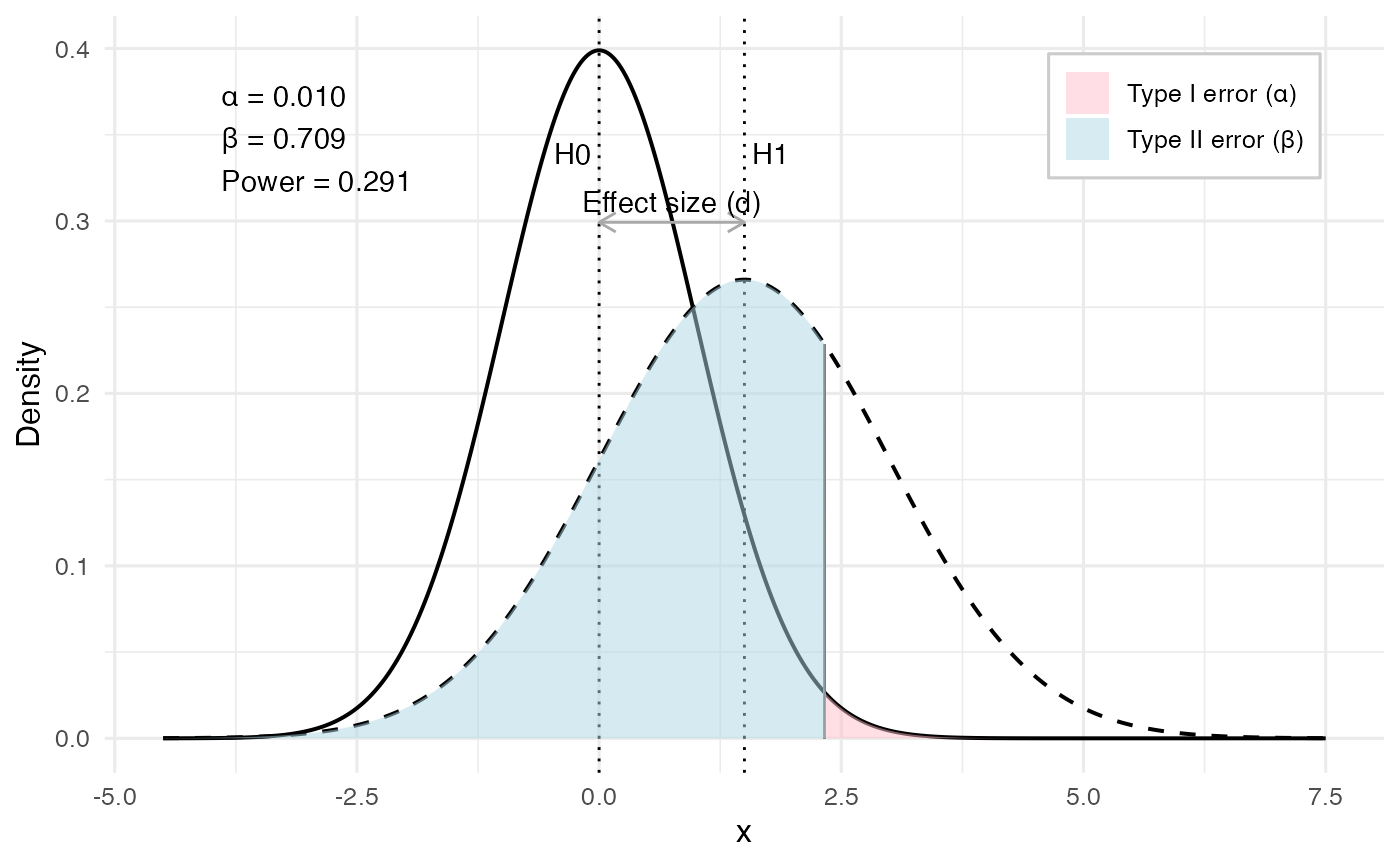
plotalphabeta.RdGenerates a plot of two normal distributions with Type I (alpha) and Type II (beta) error areas shaded. Legend and effect size annotation are embedded in the plot.
plotalphabeta(
  m = 0,
  sd0 = 1,
  sd1 = 1,
  d = 2,
  alpha = 0.05,
  fill = TRUE,
  col_fill = c("pink", "lightblue"),
  show_text = TRUE,
  show_labels = TRUE
)
Arguments
- m
Mean under H0.
- sd0
Standard deviation under H0.
- sd1
Standard deviation under H1.
- d
Effect size (Cohen's d): H₁ mean is
m + d * sd0.- alpha
Significance level.
- fill
Logical. Whether to shade alpha and beta areas.
- col_fill
Character vector of length 2: colors for alpha and beta shading.
- show_text
Logical. If TRUE, prints α, β, and power in the plot.
- show_labels
Logical. If TRUE, adds labels for H0, H1, and effect size d.
Value
A ggplot object.
Examples
plotalphabeta(m = 0, sd0 = 1, sd1 = 1.5, d = 1.5, alpha = 0.01)
#> Warning: All aesthetics have length 1, but the data has 2000 rows.
#> ℹ Please consider using `annotate()` or provide this layer with data containing
#>   a single row.